Create Effective Reports, Track Key Performance Indicators, and Boost Sales Strategy by Leveraging Zoho CRM's Built-In Analytics
What is your goal for CRM Analytics?
While the question of "what is your goal" may initially seem silly, it is important to start with a goal before outlining analytics results. Many companies have not answered this key question, which leads to a long list of random data points with no bigger purpose. Take time to consider it more and discuss analytics with the team. More specifically, what data or numbers will help you to make decisions that improve the business?
We have a few suggestions for goals you may consider, or at least get you thinking about how it applies to your business:
1. Overall Sales vs. Profit.
If you have a Deals / Opportunities module in your CRM that you are using to track sales, then obviously you want to know how you're doing. On a quarterly basis, you can set a KPI that leads to your annual goal.
One big specific thing to consider is the difference between revenue and profit. If you have a simple calculation for your profit (i.e. 30% of the total), then we recommend adding that formula field to your Deals / Opportunities module. This will make it easier to calculate. And for more robust reporting and analytics look to a platform that allows for multiple data sources, such as Zoho Analytics or Tableau, to calculate overall success.
2. Sales Cycle and Duration (Sales Velocity)
It's certainly helpful to understand the length of your sales cycle - how long it takes from the time you create a Lead/Prospect to the time a deal is set to won. Understanding your sales cycle or the time to conversion can be a huge help to both your marketing and sales departments.
Sales velocity measures how fast you’re making money. "It looks at how quickly leads are moving through your pipeline and how much value new customers provide over a given period."
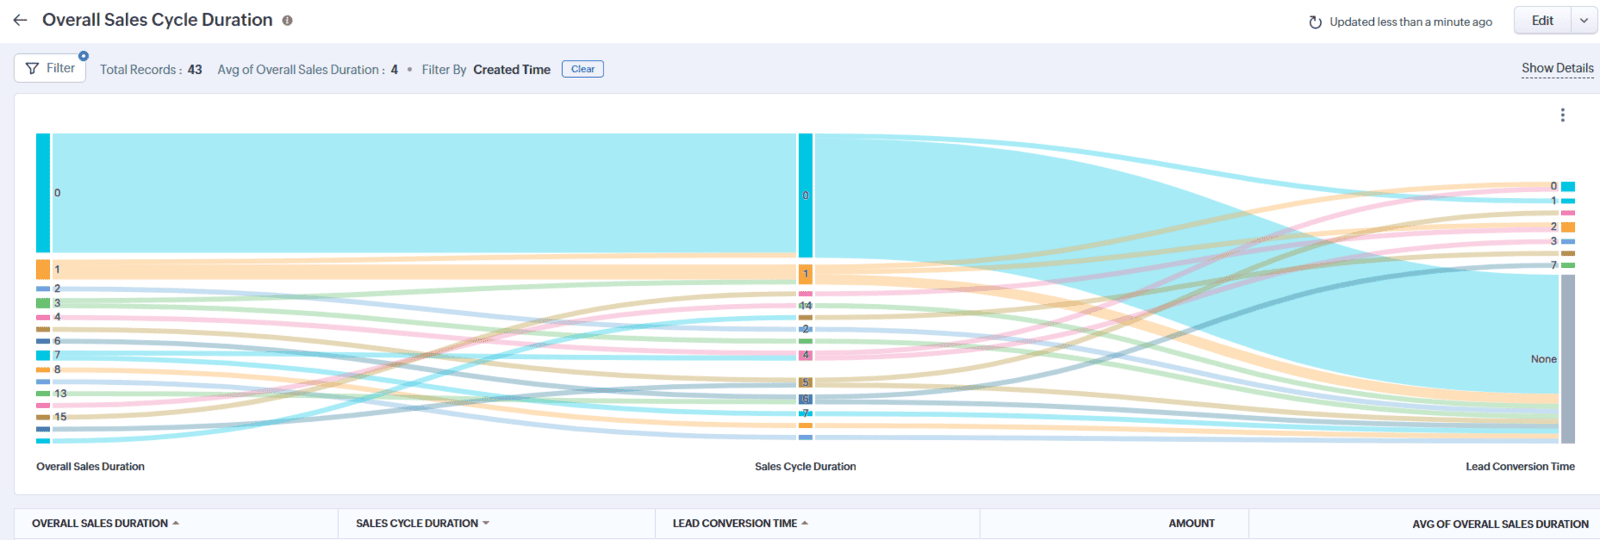
In your CRM reports, you might already have a default "Overall Sales Cycle" report that you can customize to match your business needs. Alternatively, you can build a new report with the Deals module as the main focus. Examine the data for Overall Sales Cycle, Sales Cycle, and Lead Conversion Time—each is measured in days. The Overall Sales Cycle encompasses the entire duration from the moment a lead is created to when it is converted, including both the Sales Cycle (from deal creation to marking it as Won) and the Lead Conversion Time (from lead creation to conversion).
3. New Vs. Existing Customers / Clients
Especially for B2B companies, it is important to understand where your revenue is coming from. Are you generating more revenue from existing clients or are you dependent on finding new clients every month? And what is the cost of acquiring a new client verses nurturing an existing one?
First, you will need a picklist field in the Deals module where you can identify if it is a new client or a returned client and potentially include recurring client as an option. If you have clearly marked that field accordingly, then you can report on the revenue and frequency of Deals as they relate to being New or Returned.
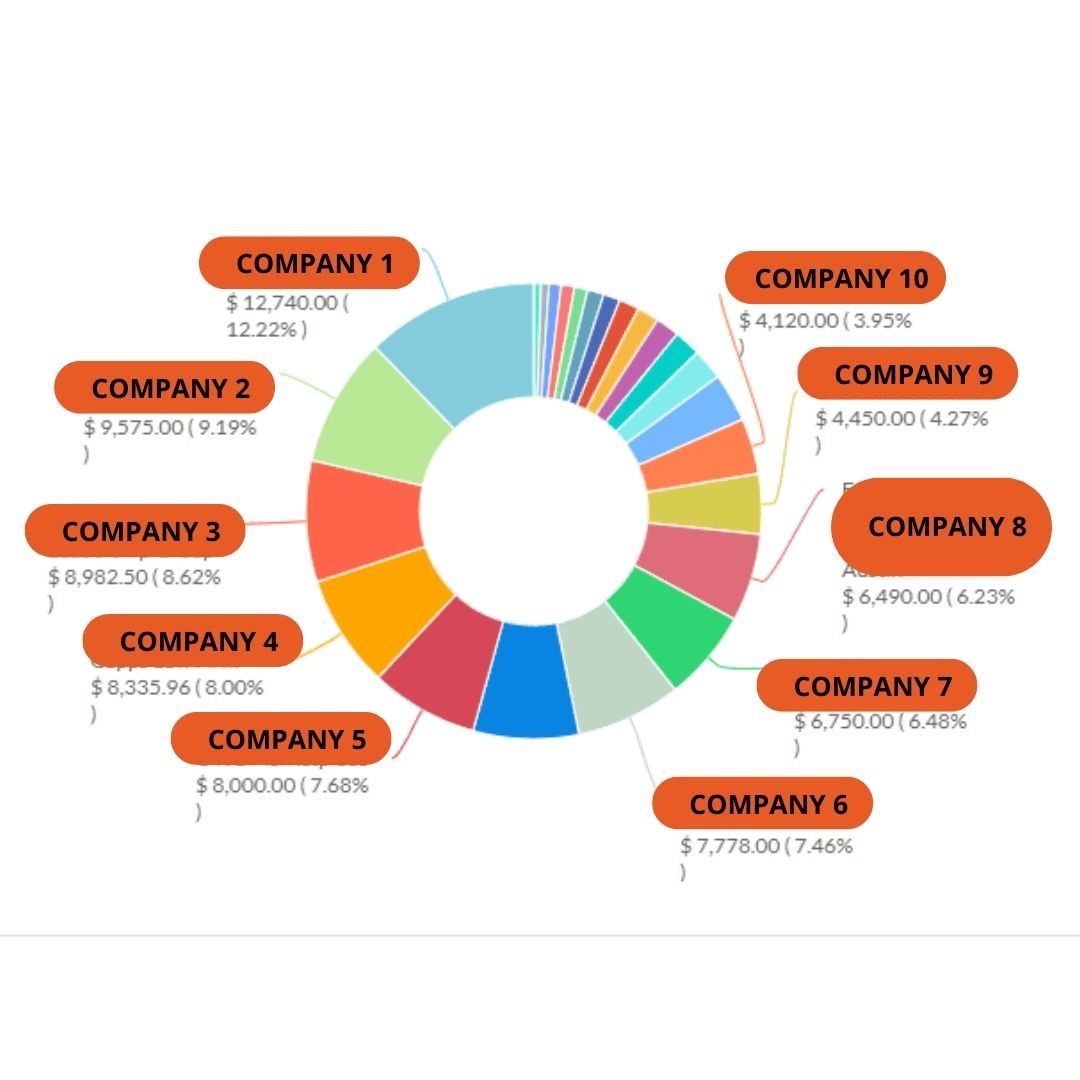
A second layer to the concept of evaluating new vs existing clients is Key Accounts. This is a default report in your CRM Reports Which accounts produce the most revenue for your business?
4. Lead Sources
Where your best, most qualified leads come from? Many business owners are guessing and assuming they know their lead sources. Be sure to properly track this information in your CRM - either through a Lead Source field or a CRM "campaign".
Perhaps you want to use a combination of Lead Source field and Campaigns. A general grouping in the Lead Source field may be "Website" or "Web Form", but you can track the specific form or lead magnet using the campaigns module.
TIP: We often suggest renaming the campaigns module to Initiatives because the terminology can be confusing when you also use Zoho Campaigns or Zoho Marketing Automation for broadcast emails.
5. Industry Specific
Every company and industry has specific parameters for measuring potential and success. For an attorney, it may be the kinds of cases (i.e. Child Custody, Divorce, Custody Modification, Adoption). A financial institution might focus on certain areas within the country where it provides loans. In a coaching company, you might choose to track outcomes based on the coaching program type or the length of the coaching engagement.
RECOMMENDATION: You do not need to measure everything. Choose your top 5 items that actually impact your business and success.
We Love Zoho's CRM Analytics But Sometimes You Need More
The built-in reports in Zoho CRM allow you generate robust reports about the data you have collected in your CRM. You can look at information that goes across two or three different modules – as long as they are related.
Combining CRM data with other sources, such as your bookkeeping, falls outside of Zoho CRM's Analytics. When your goal is to get bigger picture analysis, we recommend using Zoho Analytics to produce more detailed reports and dashboards that you can share, email, export, or even embed. Included in Zoho Analytics is Zia - robust AI – that allows you to dig deeper into your business intelligence.

Reading and understanding your CRM analytics within Zoho Analytics is...well, it's fun if you like charts and data. You can create dashboards with multiple charts and reports including widgets for tracking your KPIs.
For us, one of the big selling points is that you can blend and compare data from various sources. For example, you may want to see how your broadcast emails sent out of Zoho Campaigns impacted your Deals tracked in Zoho CRM during a certain time period. The image below shows the option for Data Blending between Zoho Campaigns and Zoho CRM where the contact's ID is used to connect the two data sets.
Recommendations When Using Zoho Analytics for CRM Reports
It is easy to get lost in the sea of possible reports and charts in any analytics platform. Zoho tries to make things easy for you by automatically generating charts, which can often lead to the feeling of overwhelm. To begin using Zoho Analytics effectively, you need to understand four main concepts: Workspaces, Data Sources, Reports, and Dashboards.
Workspaces (Housing Data)
Think of a Workspace as a studio for data. It's the central place where you:
- Group your data: Your raw data is organized into entities called Tables.
- Create everything: All your reports and dashboards live here.
- Collaborate: It provides ways to share and work with others.
- Structure data: It stores information about how your different data sets relate to each other.
You can have multiple Workspaces in your account, which you can either own or which have been shared with you by other users.
Data Sources (Where Your Data Comes From)
A Data Source is simply the place where the information you want to analyze is coming from (i.e. Zoho CRM, Google Analytics, Quickbooks). Zoho Analytics allows you to pull data from many places, including:
- Local files (like CSVs or Excel)
- Web URLs or Cloud drives (like Zoho Sheets & Google Sheets)
- Local or Cloud databases
- Popular business applications (like Salesforce or Zoho CRM)
- Your own custom applications
Reports and Dashboards
Once your data is in a Workspace, you turn it into visual insights:
- Reports: These are individual charts, graphs, or summary views (e.g., a bar chart showing monthly sales).
- Dashboards: These are collections of multiple reports, charts, and key performance indicator (KPI) widgets displayed together on one screen for a high-level overview.
5 Tips to Help Get Started with Zoho Analytics
1. Go Through Settings First
Before connecting any data, quickly review your organization's settings. Ensure the correct Time Zone is set, and confirm who your Account Administrator and Workspace Administrators are. We also recommend knowing where the Database Backup option is, as it's your safety net for raw data (but remember, it doesn't back up reports!).
Understanding User Roles and Management: Zoho Analytics allows for great collaboration by letting you add and manage users with different roles. The Key Roles Include:
- Account Administrator: This is the highest level. They are the only ones who can create or delete Workspaces. They have full privileges to manage users, create everything, and share reports.
- Workspace Administrator: They have almost all the same privileges within a specific Workspace (creating reports, managing users, sharing), but cannot create, delete, or backup the entire Workspace.
- Shared User / Viewer: These roles are typically for users who primarily need to view and interact with the reports and dashboards that have been shared with them.
Data Backup
We love that Zoho Analytics offers a Database Backup option for each Workspace. This is important if you want a local copy of your raw data. Note: The backup feature only copies the data from your tables and any SQL queries from query tables. It does not back up the reports and dashboards themselves.
2. Take it Slow with Data Source Setup
When you first add Zoho CRM as a data source in Zoho Analytics, go through the process slowly. There are several small things to notice while getting started, such as the time zone setting, which fields you want to sync, and how often. This may sound obvious, but it can drive you crazy if you expect data to be up to date in real-time when the sync can only be as frequent as every 3 hours.
The most critical detail to check is the Sync Frequency. It’s easy to assume your data is real-time, but Zoho Analytics typically syncs only as frequently as every 3 hours. Expecting instant updates when your setting is hourly or tri-hourly can be frustrating.
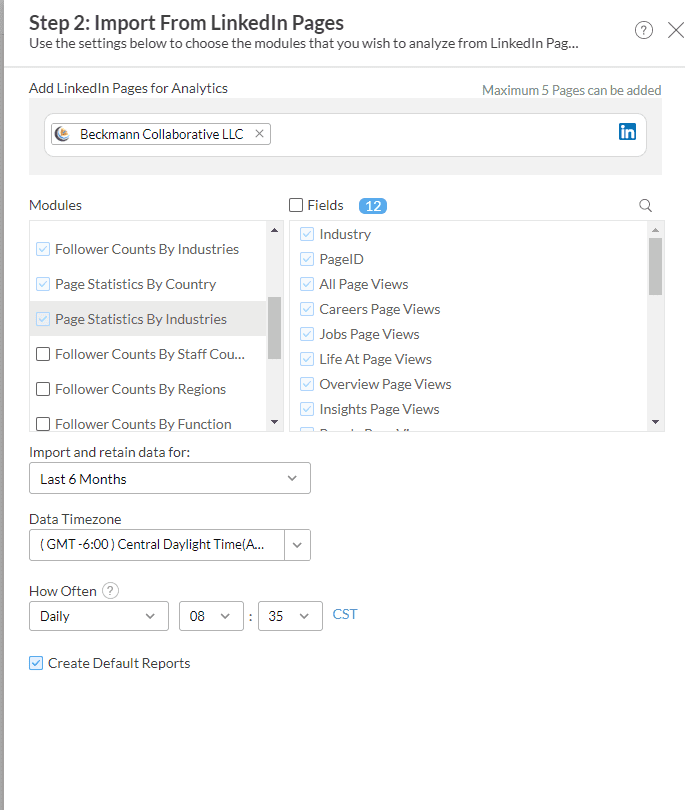
In this image, you can see there are many different things to review before you click that "Create" button including what fields you want to sync, importing and retaining data, timezone, and frequency of syncing the data. And, of course, deciding if you want to create default reports.
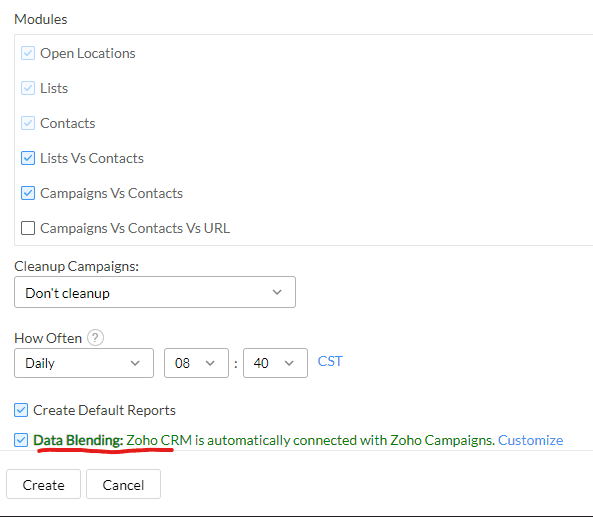
Another option you may see is "Data Blending" which can be so powerful and important for your reporting.
Data blending involves merging data from different sources or datasets (i.e. CRM and Campaigns) to generate correlated reports. Zoho Analytics detects the relationships between the connected data sources and integrates the data across the tables available in those sources.
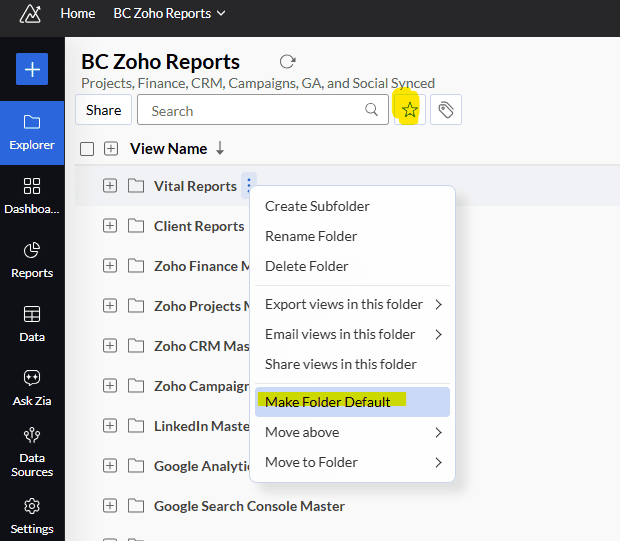
4. Edit the Default Reports and Dashboards, Rather than Starting from Scratch
Leverage Auto-Generated Content. Save time and effort by using the reports and dashboards that Zoho Analytics automatically generates when you import data. As previously mentioned, when you import data from your CRM, Zoho Analytics will automatically generate reports and dashboards for you.
Sometimes the idea is right with the report, but you might want an additional data point or a different filter. That is much easier to do that building from a blank canvas.
5. Pro Tip: Use Zia (Zoho’s AI)
Don't miss this powerful tool for report creation. Zia is an AI-powered chatbot that lets you generate reports by simply asking questions, such as "What was the total revenue from deals closed last quarter?"
It also includes Zia Insights and Auto-Analysis, which delivers automated, context-sensitive insights into your data without requiring manual report creation. These three core features—Ask Zia, Zia Insights, and Auto-Analysis—streamline data exploration: Ask Zia acts as an intelligent assistant to generate reports through natural language queries, while Zia Insights offers a concise summary of key findings directly within your current reports.
Choosing the Right Tool for Your CRM Data
Analyzing your critical CRM data should go beyond just viewing numbers—it's about transforming them into meaningful business decisions. To achieve this, you need the right tools. Zoho CRM offers excellent built-in reporting for everyday operational insights, making it ideal for quick summaries, real-time totals, basic lead reports, and standard pipeline views. But as your business becomes more complex or as you explore deeper, cross-module analyses, you'll soon encounter limitations. That’s when a powerful, dedicated analytics platform like Zoho Analytics becomes indispensable.
Leverage Zoho Analytics when you need to Unite Data, use Complex Filtering and Formulas, and get Advanced Visualizations.
Combine your CRM data with information from marketing platforms, finance tools, or external spreadsheets for a true 360-degree view. Go beyond standard filters to create custom business logic and sophisticated metrics (like calculating Lifetime Value or complex retention rates). Design professional, interactive dashboards that tell a complete story to executives and stakeholders.
Don't force a basic tool to do an advanced job. Use your CRM's built-in reports for immediacy, and leverage the power and flexibility of Zoho Analytics for the deep dives, predictive insights, and comprehensive reporting that will truly move your business forward.
Start simple, but be ready to scale your reporting capabilities when your questions demand it. The insights waiting in your CRM data are too valuable to leave behind!
A few more resources to help you get ideas about what to analyze and how to handle it from the team at Zoho:
Business intelligence vs data analytics: 10 key differences - https://www.zoho.com/blog/analytics/business-intelligence-vs-data-analytics-10-key-differences.html
Overview of CRM Analytics components: https://help.zoho.com/portal/en/kb/crm/analytics-and-dashboards/analytics-or-dashboards/overview/articles/analytical-components
Advanced Analytics for Zoho CRM: zoho.com/analytics/help/connectors/zohocrm-solution.html